Blog
Designing dashboards that drive real decisions.
Start from the decision, not the data: fewer numbers, each with an owner, a threshold and a one-click path to the records behind it.
A dashboard that drives real decisions answers one question for the person looking at it: what should I do next? Most dashboards fail that test because they show everything the data could measure instead of the handful of numbers one role can act on. Good dashboard design starts from the decision and works back to the metrics, not the other way round.
The cost of getting it wrong is more than a cluttered screen. In a February 2025 survey commissioned by SoftServe, an IT consultancy, and run by Wakefield Research, 58% of business leaders worldwide said key business decisions are based on inaccurate or inconsistent data most of the time, if not always, rising to 65% in Asia-Pacific (SoftServe). A dashboard is where data turns into either a confident decision or an expensive guess.
Choosing metrics that actually matter
The first job of dashboard design is deciding what not to show. Every metric competes for attention, so each one has to earn its place by influencing a real decision. For any candidate, ask three questions:
- Who looks at this number, and what decision do they make with it?
- If it moved sharply, would anyone change what they do this week?
- Can the person who owns it act on it, or only watch it?
If the honest answer to the last one is "we would watch it", the metric belongs in a report, not on the main view. Metrics that drive decisions tend to sit close to the work. For a hotel, that is the occupancy forecast against staffing, not lifetime brand sentiment. For a clinic, it is no-show rate and room use, because a manager can reschedule or change capacity in response.
Data quality quietly decides everything here: a well-designed dashboard on bad inputs still produces bad decisions. In research for Adverity, a marketing data platform, 200 chief marketing officers in the US, UK, Germany, Austria and Switzerland estimated in 2025 that on average 45% of the data their teams use is incomplete, inaccurate or out of date, yet 85% said they trust the quality and completeness of their data. Before polishing the visuals, check that the numbers feeding them are current and correct.
Avoiding vanity-metric clutter
Vanity metrics look impressive and change almost nothing. Total page views, cumulative sign-ups and all-time revenue share one flaw: they only go up, so they rarely signal a decision. They are not false; they crowd out the numbers that matter. When a manager opens a screen full of all-time totals, the one figure that needs attention this morning gets lost. A few patterns separate actionable metrics from vanity ones:
- Rates over totals. Conversion rate reflects current performance; total conversions reflect history.
- Recent over cumulative. "Bookings this week against last week" prompts a response; "bookings since launch" does not.
- Segmented over aggregate. An average hides the problem; a breakdown by channel, location or team shows where to act.
With the vanity metrics gone, the dashboard looks sparse, and that is the point. Every number left on screen is there to be used.
Role-based views for different users
One dashboard for the whole company almost always fails, because a finance director and a front-desk supervisor make different decisions from the same data. Role-based views show each person the numbers they can act on.
Take a tour operator. The operations lead needs today's departures, guide assignments and capacity gaps. Finance needs margin by tour, payments due and refund exposure. Marketing needs booking pace by source. The same database feeds all three, but one screen holding everything would bury each role's priorities under the others'. Role-based design is also about permissions: not everyone should see payroll or margins, and a dashboard that shows sensitive numbers to the wrong role is a governance problem as much as a design one.
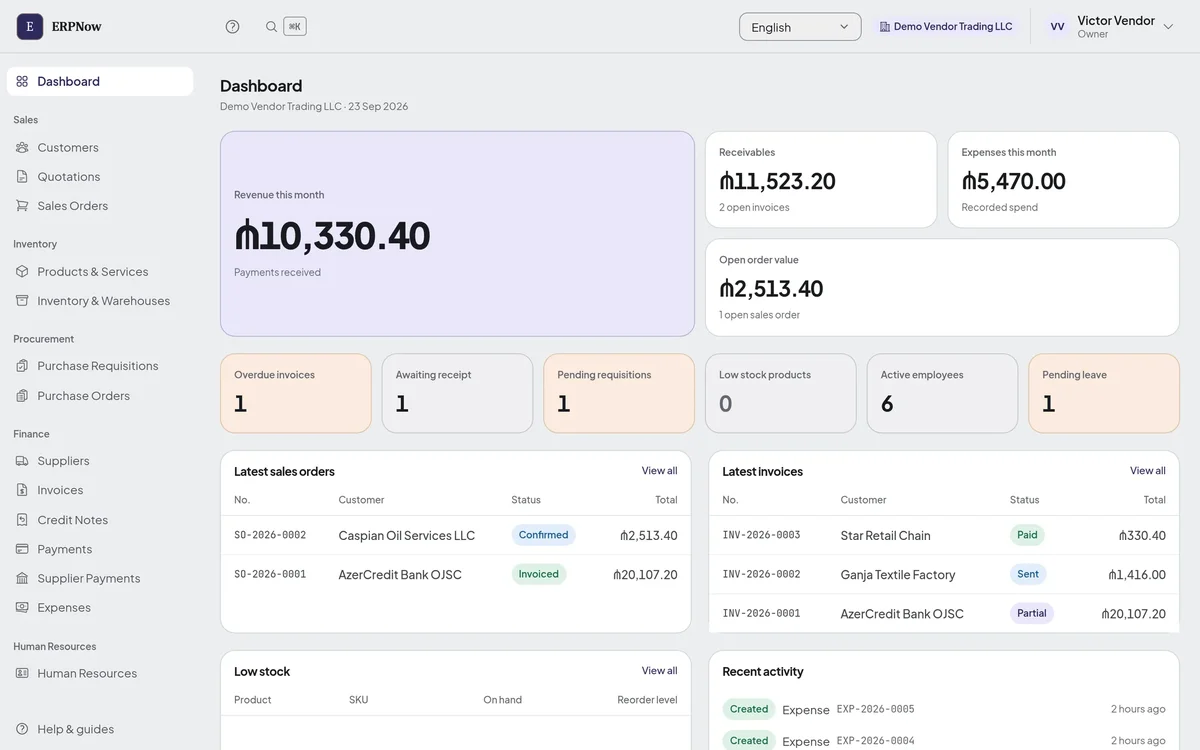
In our own ERPNow, the dashboard shows the parts of the business the account actually uses: a tile for purchase orders or employees appears only when those modules are switched on. Across our systems, each person only opens the modules they have been given, checked on every page rather than just hidden from the menu. The tour operator system's dashboard, for example, leads with departures loading, sales this month, unconfirmed services and payments due.
Real-time vs scheduled reporting
Not every decision needs live data, and treating everything as real-time wastes effort and attention. The right cadence depends on how fast the decision has to happen.
Live figures suit operational decisions with a short window: a front desk watching room availability, a support team watching the queue, a dispatcher watching vehicles. A delay of an hour makes that data useless. Scheduled reporting suits decisions where the trend matters more than the current second: weekly revenue by segment, monthly churn, quarterly utilisation. A scheduled summary also forces a moment of review, which a constantly refreshing screen does not.
- Choose live when someone will act within minutes or hours and the current value drives the action.
- Choose scheduled when the decision is periodic and direction matters more than the live figure.
- Do not default to live. Real-time pipelines cost more to build and run, and they can create false urgency around numbers that do not need it.
Many operations end up with both: a live screen for the day's work and periodic summaries for weekly and monthly review. Note that when the dashboard reads straight from the system the business runs on, as ours do, "live" costs nothing extra; the expense comes from copying data out of several systems into a separate reporting tool.
Turning data into action
A dashboard only matters at the moment someone changes what they do because of it. Three habits close the gap:
- Give every metric an owner. A number nobody owns is a number nobody acts on.
- Pair the metric with a next step. Next to "no-show rate climbing", the useful dashboard implies the action: tighten reminders, adjust the schedule.
- Set thresholds, not just values. 82% means little on its own; "flag anything below 80%" turns a display into a signal.
Context decides whether a number leads anywhere. "Occupancy 71%, target 85%, down from 78% last week" tells a manager how worried to be and which way to move. And the path from a worrying number to the detail behind it should be one click. On the ERPNow dashboard below, "Overdue invoices" opens the invoice list already filtered to overdue ones, and "Low stock products" counts the products at or under the reorder level you set, so the number and the list it came from always match.
Questions about dashboard design
What is business dashboard design?
Choosing, arranging and presenting the right metrics so a specific person can understand performance at a glance and decide what to do next. Good design starts from the decision, not the data.
How many metrics should a dashboard show?
As few as the viewer's decisions need, usually a handful. If a number would not change what anyone does this week, move it to a report or a drill-down screen.
What is the difference between real-time and scheduled reporting?
Real-time reporting updates continuously and suits operational decisions that need a fast response, like bookings or a support queue. Scheduled reporting delivers summaries on a fixed cycle and suits reviews where trends matter more than the current figure.
Do I need custom reporting software or an off-the-shelf tool?
Off-the-shelf tools work when your data and workflows fit their model. Something built for you makes sense when your operation has its own data, roles or systems that a generic dashboard cannot connect cleanly. Check first whether the system you run the business on already reports from its own data.
Pick one role and one decision that role makes every week. Build a small dashboard that shows only the numbers that decision depends on, check the data behind them, and give each an owner and a threshold. Once that view earns its keep, do the next role. Tell us the decision and we will show you how our systems report on it today.